BANL 6100: Business Analytics
Describing Data – II
Mehmet Balcilar
mbalcilar@newhaven.edu
Univeristy of New Haven
2023-09-28 (updated: 2023-10-25)
Skewness & Kurtosis
Introduction
- a normal distribution to be symmetrical in shape
- real-world data are often have asymmetric distributions
- asymmetry in a distribution is measure by skewness
- kurtosis (peakedness) defines whether a distribution is truly normal
- or whether it may have so-called fatter or thinner tails
Symmetric Distributions – I
- A distribution is symmetric if the relative frequency or probability of certain values are equal at equal distances from the point of symmetry.
- The point of symmetry for normal distributions is the mean (and at the same time median and mode!)
- The most common symmetric distribution is the normal distribution.
- However, there are a number of other distributions that are symmetric.
A symmetric distribution has the following property:
Q3−Q2=Q2−Q1 where Q1, Q2, and Q3 are 1st, 2nd, and 3rd quartiles. Thus the ratio (Q3−Q2)/(Q2−Q1) can be used as a measure of asymmetry.
Symmetric Distributions – II
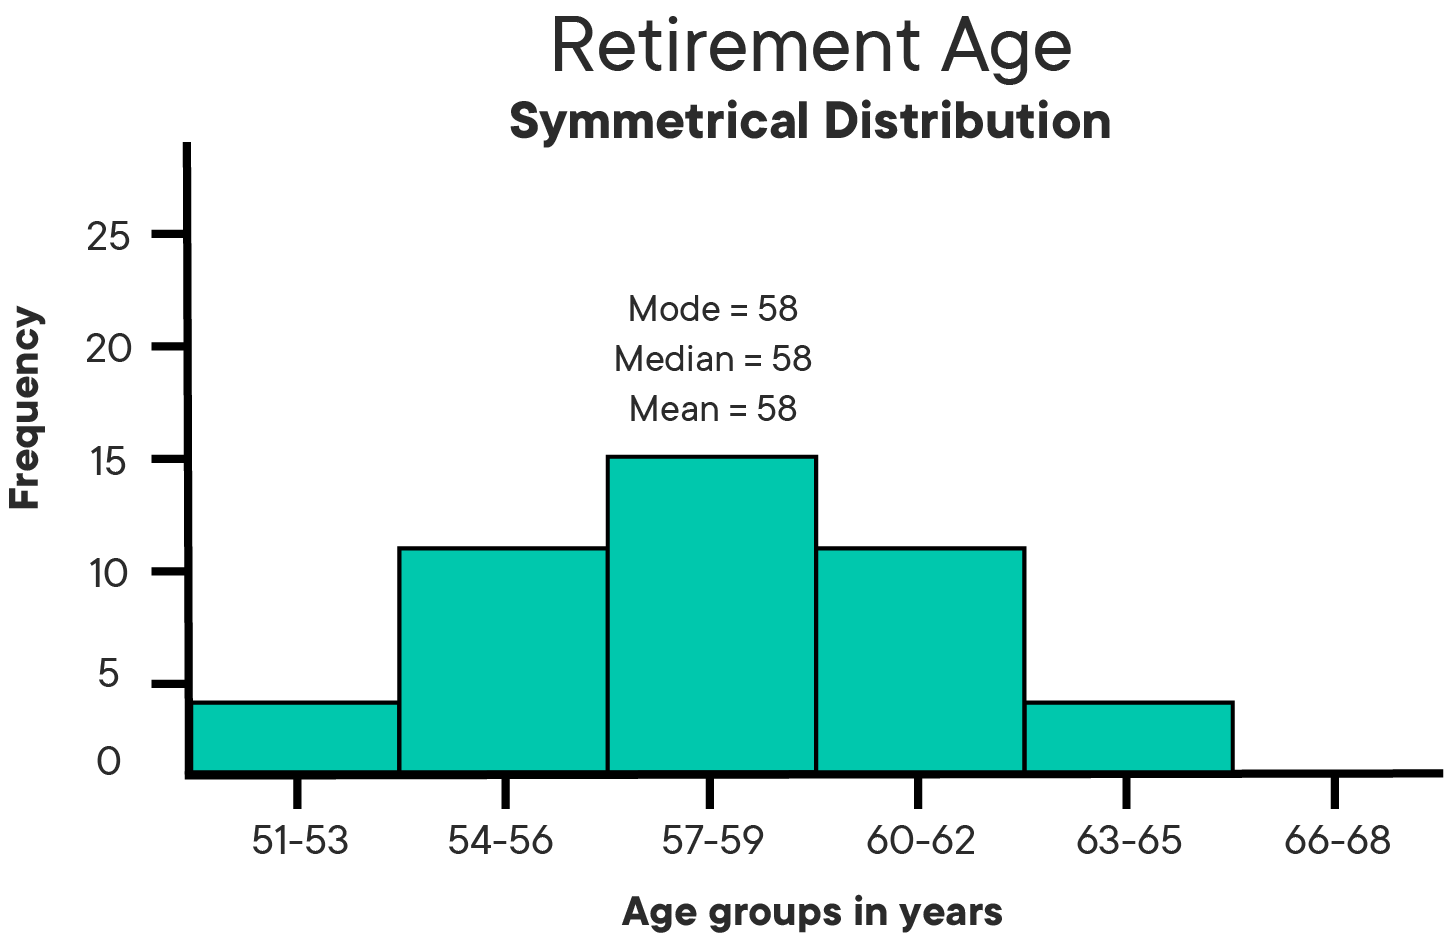
Have a look at following histogram:

This distribution meets all of the conditions of being symmetrical.
Skewness
- Skewness is the degree of distortion or deviation from the symmetrical normal distribution.
Skewness can be seen as a measure to calculate the lack of symmetry in the data distribution.
Skewness helps you identify extreme values in one of the tails. Symmetrical distributions have a skewness of 0.
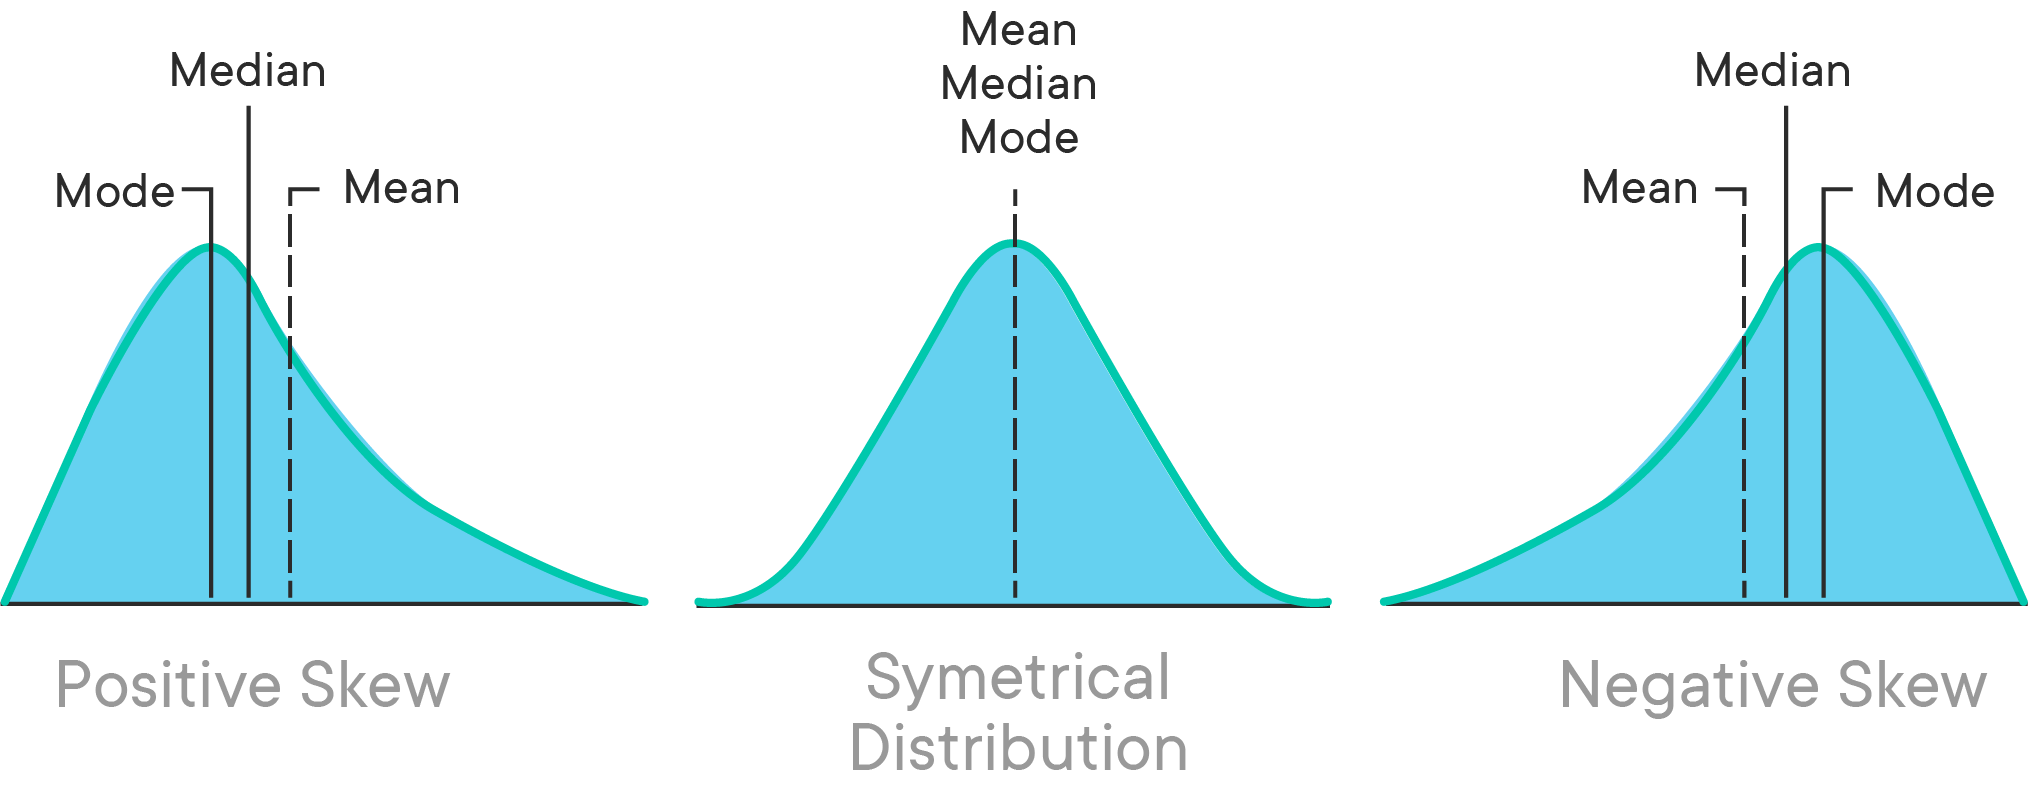
Positive Skewness
- A distribution is positively (right) skewed when the tail on the right side of the distribution is longer (also often called "fatter").
- When there is positive skewness, the mean and median are bigger than the mode.
Negative Skewness
- Distributions are negatively (left) skewed when the tail on the left side of the distribution is longer or fatter than the tail on the right side.
- When there is negative skewness, the mean and median are smaller than the mode.
Typs of Skewness

Fisher-Pearson coefficient of skewness
For univariate data x1,x2,...,xn the formula for skewness is:
g1=1nn∑i=1(xi−¯x)3s3
where ¯x is the mean, s is the standard deviation, and n is the number of data points.
The Fisher-Pearson coefficient of skewness is the most commonly used measure of skewness.
Interpreting Fisher-Pearson coefficient of skewness
The rule of thumb:
- A skewness between -0.5 and 0.5 means that the data are pretty symmetrical
- A skewness between -1 and -0.5 (negatively skewed) or between 0.5 and 1 (positively skewed) means that the data are moderately skewed.
- A skewness smaller than -1 (negatively skewed) or bigger than 1 (positively skewed) means that the data are highly skewed.
Pearson Mode Skewness
The Pearson mode skewness is used when a strong mode is exhibited by the sample data.
For univariate data x1,x2,...,xn the formula for Pearson mode Skewness is:
Sk1=¯x−mos
where ¯x is the mean, s is the standard deviation, and mo is the mode of data points.
Interpretation:
- The direction of skewness is given by the sign.
- The coefficient compares the sample distribution with a normal distribution. The larger the value, the larger the distribution differs from a normal distribution.
- A value of zero means no skewness at all.
- A large negative value means the distribution is negatively skewed.
- A large positive value means the distribution is positively skewed.
Pearson's Second Coefficient (Pearson Median Skewness)
Pearson's second coefficient is used when the data includes multiple modes or a weak mode.
For univariate data x1,x2,...,xn the formula for Pearson mode Skewness is:
Sk2=3(¯x−md)s
where ¯x is the mean, s is the standard deviation, and md is the median of data points.
It has the sam interpretation as the Pearson mode skewness.
Remedies for Skewewness
You generally have three choices if your statistical procedure requires a normal distribution and your data is skewed:
Do nothing. Many statistical tests, including t tests, ANOVAs, and linear regressions, aren’t very sensitive to skewed data. Especially if the skew is mild or moderate, it may be best to ignore it.
Use a different model. You may want to choose a model that doesn’t assume a normal distribution. Non-parametric tests or generalized linear models could be more appropriate for your data.
Transform the variable. Another option is to transform a skewed variable so that it’s less skewed. “Transform” means to apply the same function to all the observations of a variable.
Transformations Based on the Type of Skewness
| Type of skew | Intensity of skew | Transformation |
| Right | Mild | Do not transform |
| Moderate | Square root | |
| Strong | Natural log | |
| Very strong | Log base 10 | |
| Left | Mild | Do not transform |
| Moderate | Reflect* then square root | |
| Strong | Reflect* then natural log | |
| Very strong | Reflect* then log base 10 |
*In this context, “reflect” means to take the largest observation, xl, then subtract each observation from xl+1. Keep in mind that the reflection reverses the direction of the variable and its relationships with other variables (i.e., positive relationships become negative).
Kurtosis
- Kurtosis deals with the lengths of tails in the distribution.
- It is a measure of peakedness (or tailedness) of the distribution relative to a normal distribution
Where skewness talks about extreme values in one tail versus the other, kurtosis aims at identifying extreme values in both tails at the same time!
- You can think of Kurtosis as a measure of outliers present in the distribution.

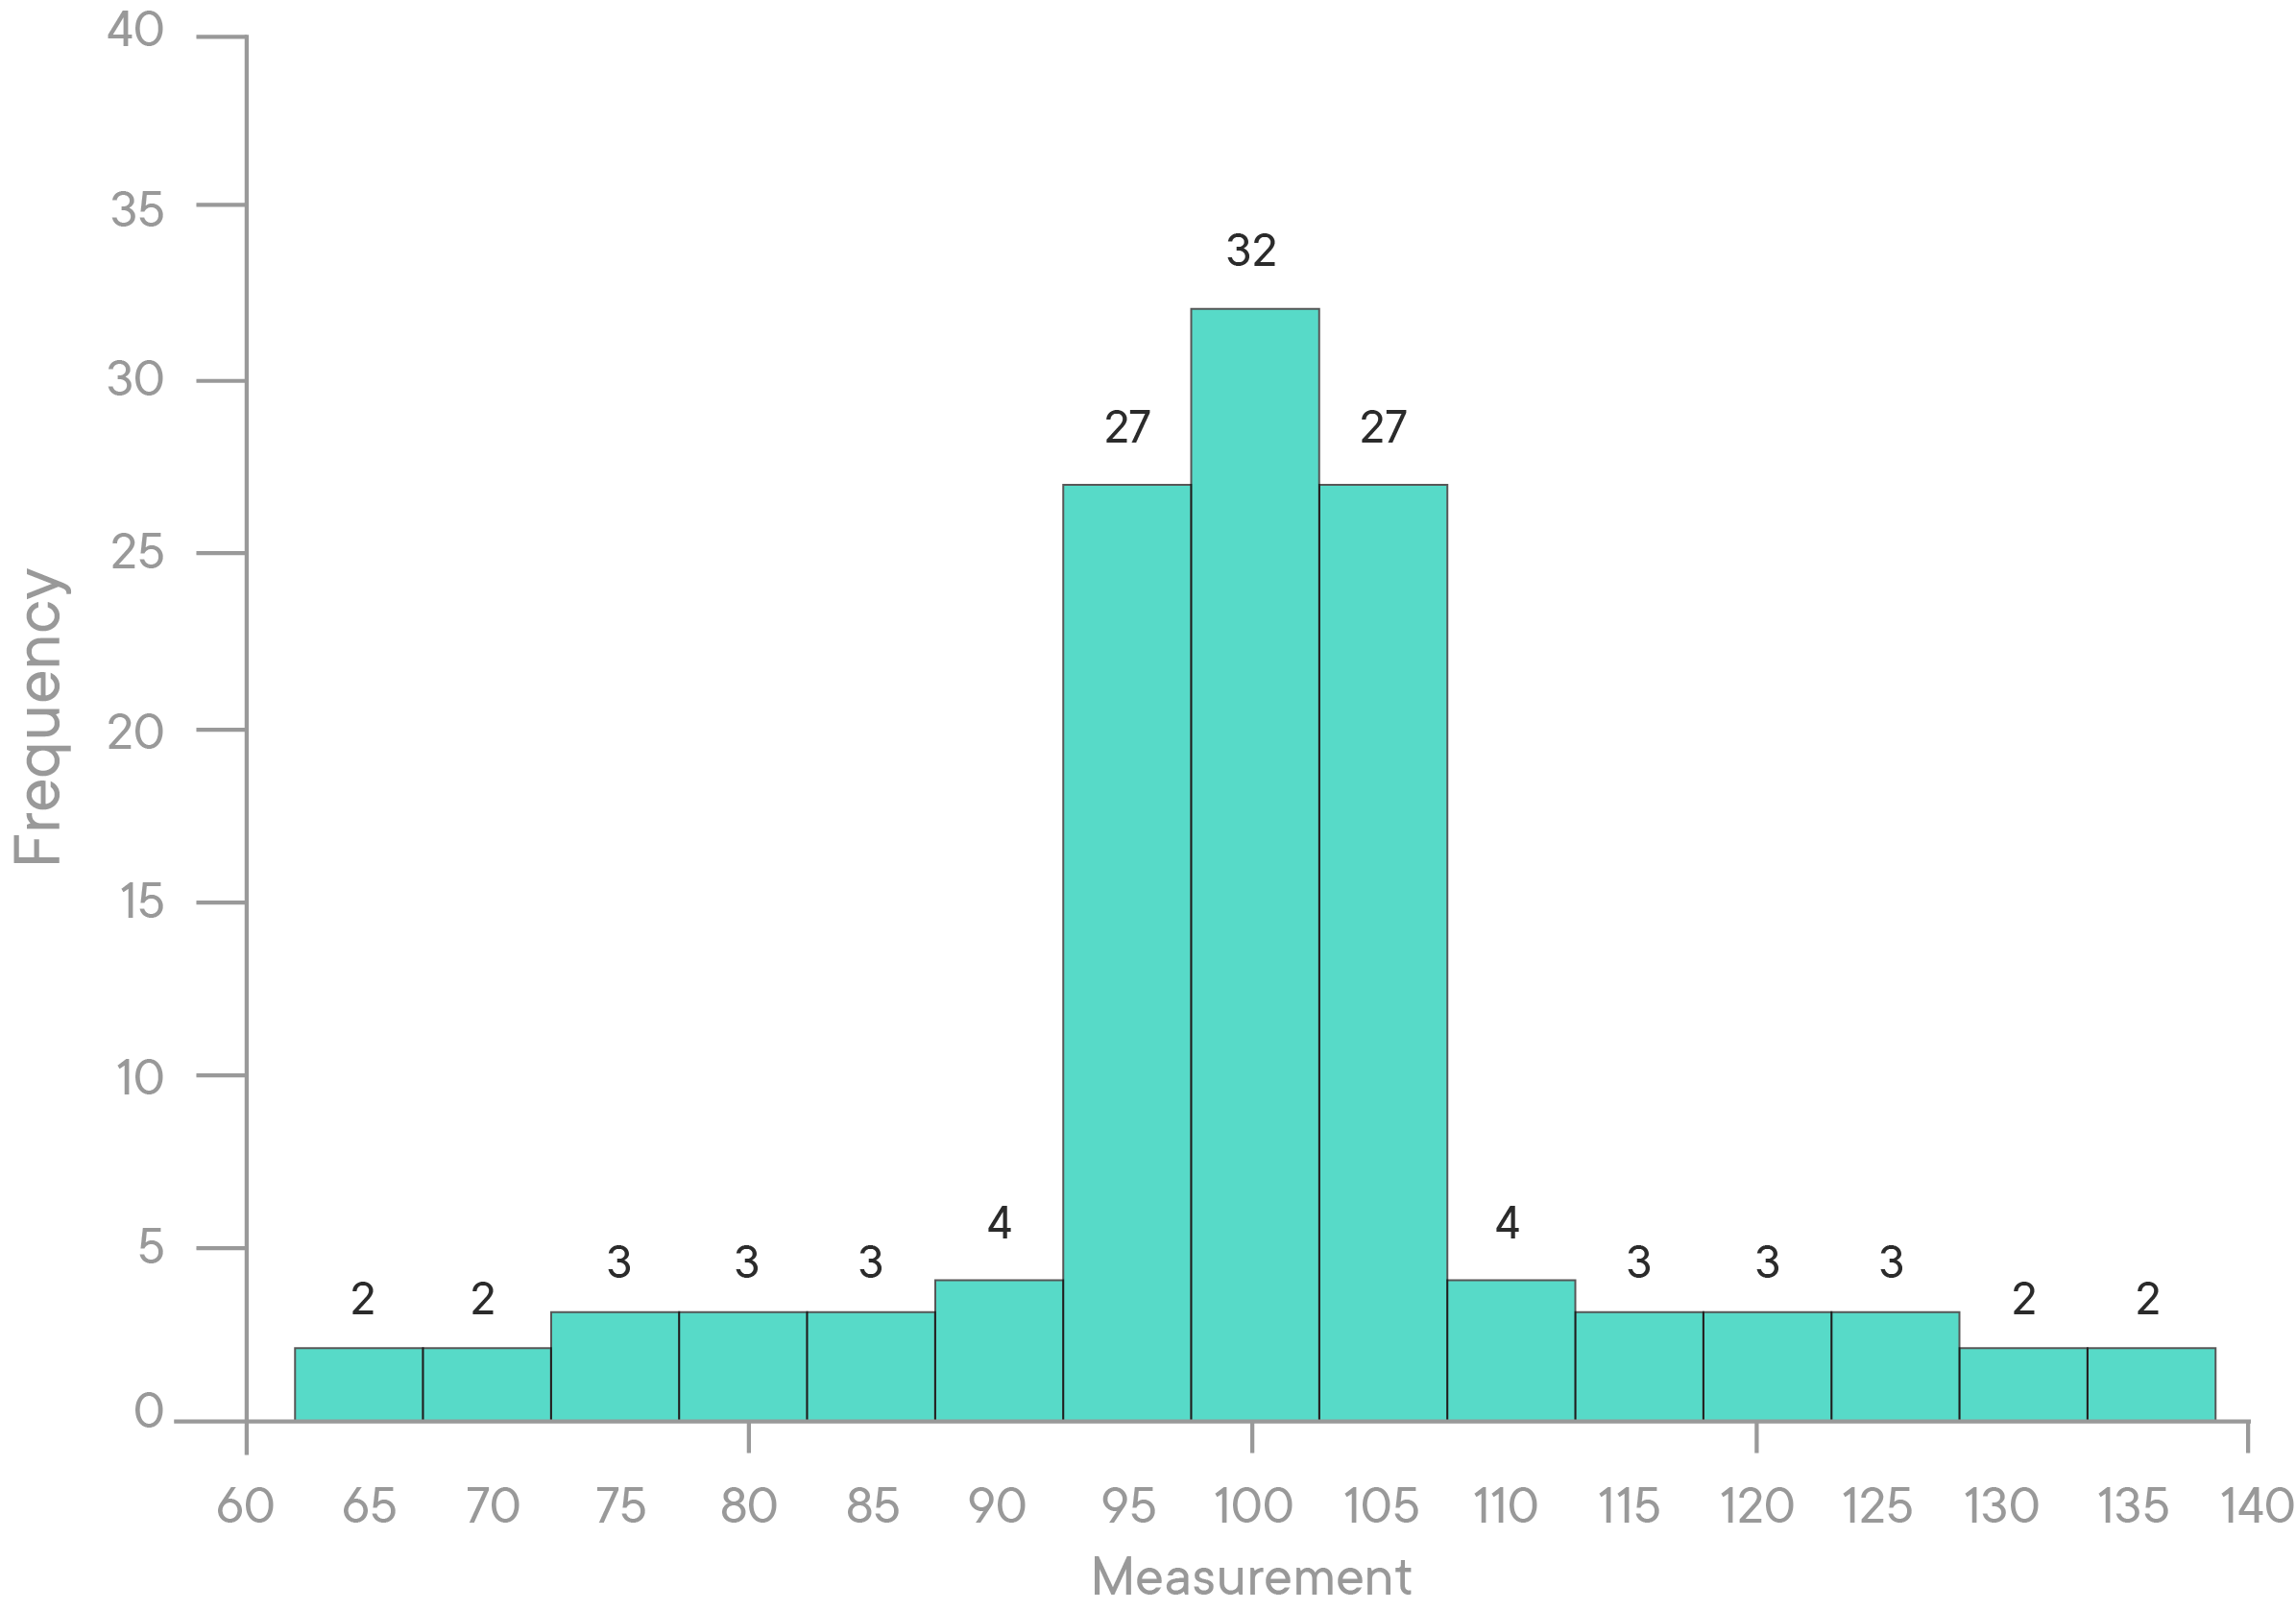
The distribution denoted in the image above has relatively more observations around the mean, then a steep decline and longer tails compared to the normal distribution.
Measuring Kurtosis
For univariate data x1,x2,…,xn the formula for kurtosis is:
k=1nn∑i=1(xi−¯x)4s4
If there is a high kurtosis, then you may want to investigate why there are so many outliers.
Low kurtosis in a data set is an indication that data has light tails or lacks outliers. If we get low kurtosis, then also we need to investigate and trim the dataset of unwanted results.
Excess kurtosis
In practic, excess kurtosis, which is defined as Pearson's kurtosis minus 3, to provide a simple comparison to the normal distribution.
ke=k−3=1nn∑i=1(xi−¯x)3s3−3
Types of Kurtosis

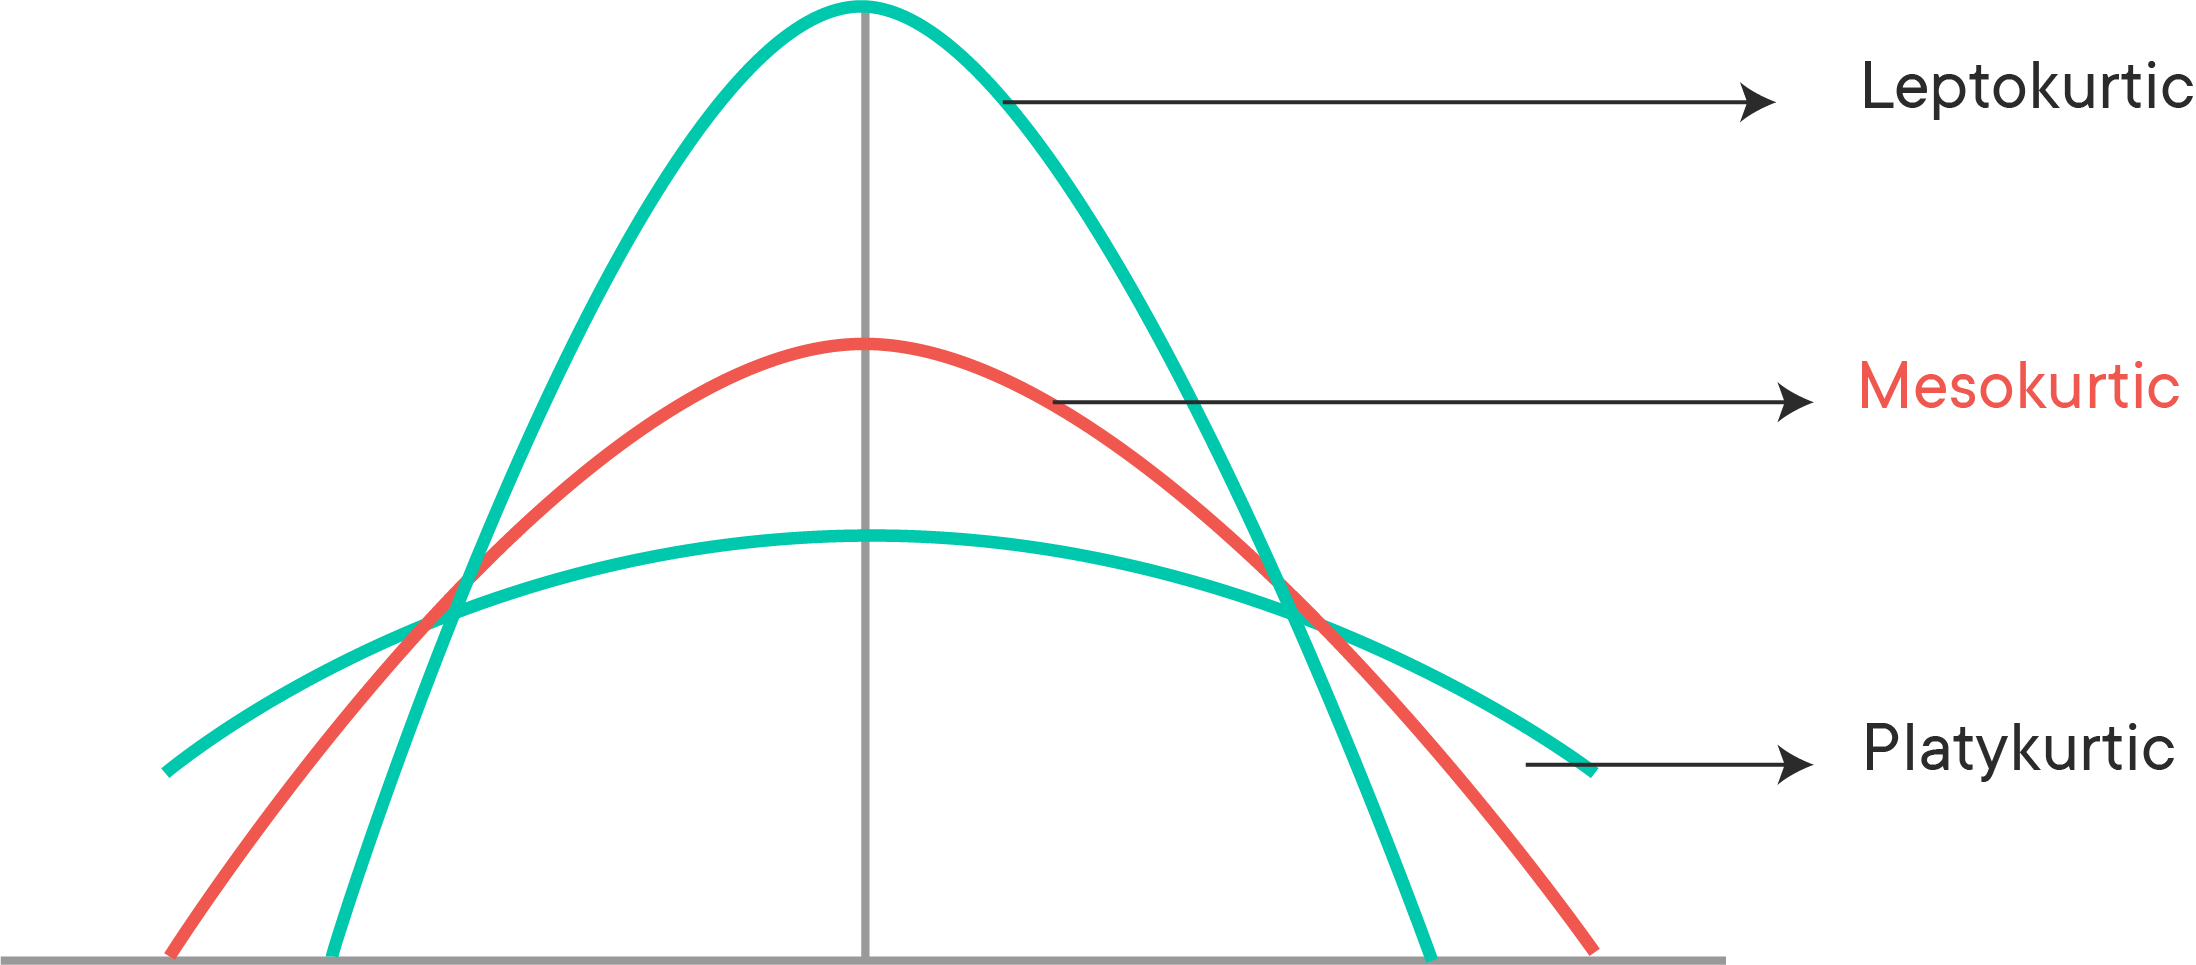
Mesokurtic (k≈3)
A mesokurtic distribution has kurtosis statistics that lie close to the ones of a normal distribution. Mesokurtic distributions have a kurtosis of around 3. According to this definition, the standard normal distribution has a kurtosis of 3.
Platykurtic (k<3)
When a distribution is platykurtic, the distribution is shorter and tails are thinner than the normal distribution. The peak is lower and broader than Mesokurtic, which means that the tails are light and that there are fewer outliers than in a normal distribution.
Leptokurtic (k>3)
When you have a leptokurtic distribution, you have a distribution with longer and fatter tails. The peak is higher and sharper than the peak of a normal distribution, which means that data have heavy tails and that there are more outliers.
Types of Kurtosis
| Category | |||
|---|---|---|---|
| Mesokurtic | Platykurtic | Leptokurtic | |
| Tailedness | Medium-tailed | Thin-tailed | Fat-tailed |
| Outlier frequency | Medium | Low | High |
| Kurtosis | Moderate (3) | Low (< 3) | High (> 3) |
| Excess kurtosis | 0 | Negative | Positive |
| Example distribution | Normal | Uniform | Laplace |